
Firebase Studio offers a few different ways to debug your app, directly from your workspace. For web and Flutter apps, a web console and Lighthouse are directly integrated into the workspace. Flutter apps offer Android and web previews to spot-check and test your app while you code.
Richer, breakpoint-based debugging is also available for most common languages, through the built-in Debug Console, and extensible with Debugger extensions from OpenVSX. For breakpoint-based debugging of your frontend web code (like JavaScript), you can continue using your browser's built-in developer tools, like Chrome's DevTools.
Preview your app
Firebase Studio includes in-workspace app previews for web apps (Chrome) and Flutter apps (Android, Chrome). The Android and Chrome previews support hot reload and hot refresh, and offer full emulator capabilities.
To learn more about Firebase Studio previews, see Preview your app.
Use the integrated web console for web previews
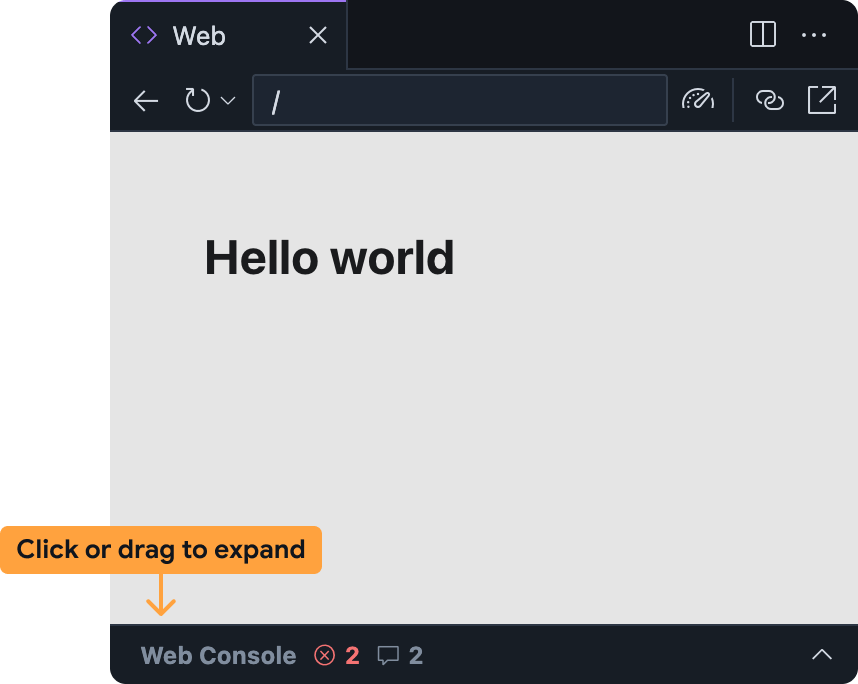
The integrated web console helps you diagnose issues in your app directly from the web preview. You can access the web console in the Firebase Studio web preview panel by expanding the bar at the bottom.
Note that this feature is experimental and isn't enabled by default. To turn it on, follow these steps, and share your feedback after you've tried it out:
Add the web console to your Firebase Studio workspace:
- Open Settings by clicking
or pressing
Ctrl + ,(on Windows/Linux/ChromeOS) orCmd + ,(on MacOS). - Find the Firebase Studio: Web Dev Tools setting and enable
it. If you're editing your
settings.jsonfile directly, you can add"IDX.webDevTools": true. - Refresh your browser window to reload your Firebase Studio workspace.
- Open Settings by clicking
or pressing
Open the web preview in Firebase Studio: Open the command palette (
Cmd+Shift+Pon Mac orCtrl+Shift+Pon ChromeOS, Windows, or Linux) and select Firebase Studio: Show Web Preview.The web console panel is minimized within the web preview panel by default. Click the bar or drag it up to expand it.
The web console panel in the Firebase Studio web preview works similarly to other consoles, such as the one available in Chrome DevTools:
- JavaScript errors and
console.logstatements will appear there as you use your app.- For errors and warnings, you also have the option to get assistance from Gemini by selecting the Understand this error button at the right of the error message.
- You can evaluate arbitrary JavaScript in the context of your web preview by using the prompt bar at the bottom.
Run Lighthouse for web previews
Lighthouse audits your app based on the specific audit categories you select, and returns a report with findings and suggestions. You can run Lighthouse reports directly from the web preview in Firebase Studio.
Open the web preview in Firebase Studio: Open the command palette (
Cmd+Shift+Pon Mac orCtrl+Shift+Pon ChromeOS, Windows, or Linux) select Firebase Studio: Show Web Preview.Click the
 Run Lighthouse icon from the web preview toolbar.
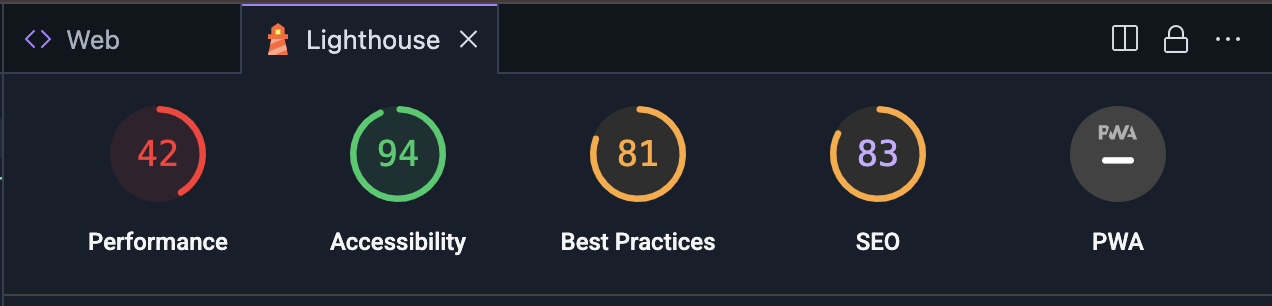 In
the Lighthouse panel, select the audit categories you want. You can
choose from reports auditing performance, accessibility,
conformance with best practices, SEO, and Progressive Web
App performance. Click Analyze page to generate the reports.
In
the Lighthouse panel, select the audit categories you want. You can
choose from reports auditing performance, accessibility,
conformance with best practices, SEO, and Progressive Web
App performance. Click Analyze page to generate the reports.The reports might take a few minutes to generate.
After the reports appear in the Lighthouse panel, you can review the findings for each audit category, or switch between audit categories by clicking the score and category name.
Use the Debug Console
Firebase Studio includes the built-in Debug Console from Code OSS. Use this console to debug your app with out-of-the-box debuggers for most common programming languages, or add a debugging extension from OpenVSX.
To customize your debugging experience, you can also add a .vscode/launch.json
file to your workspace and specify custom launch configurations. Learn more
about using launch configuration files to customize debugging at
Visual Studio Code debug
configuration.
Debug with Gemini
You can use Gemini to help you debug your code with chat in your Code workspace or the App Prototyping agent.
While Gemini can write code for you, it might sometimes also produce errors. When it detects an error, it will attempt to fix it. If you find that it isn't able to resolve the issue given the error message, you can try some of the following techniques:
Describe the issue: In the chat interface, describe the problem you're encountering as clearly and concisely as possible. While Gemini might have access to context like error messages and logs, it might not understand the full context. Describing the behavior along with the error message can help Gemini fix errors faster.
Ask specific questions: Don't be afraid to ask Gemini direct questions about your code. For example, "What could be causing a null pointer exception in this function?" or "How can I prevent this race condition?"
Break down complex problems: If you're dealing with a complex issue, break it down into smaller, more manageable parts. Ask Gemini to help you debug each part separately and think through problems step-by-step.
Use code fences: When sharing code snippets, use code fences to ensure that the code is properly formatted. This makes it easier for Gemini to read and understand your code.
Iterate and refine: Gemini may not always provide the perfect solution on the first try. Review the responses, ask clarifying questions, and provide additional information as needed.
Avoid prompting loops: If Gemini gets stuck in a loop or is unable to answer your question, try rephrasing your prompt or providing additional context. Sometimes, just rewording your question can help Gemini understand what you're asking.
If rephrasing your prompt doesn't resolve the loop, try the following techniques:
Start a new chat: If you're using Gemini chat in your Code workspace, start a new chat session to reset Gemini's context. This can help break free from any misconceptions or assumptions that Gemini may have made in the previous conversation.
Provide counter-examples: If Gemini is making incorrect assumptions, provide counter-examples to help it understand the correct behavior.